PDF Download: Economic analysis
In a nutshell: The Economic Analysis offers a sequence of related smaller tools that help to quantify the economic size of market systems; how prices vary across a market chain; and how value is created and captured by different actors. This can be useful for grounding subsequent PMSD participatory mapping sessions; for delivering on consulting assignments; and for building credibility with a wider set of market actors in a given context.
Status: Optional Tool
Key principles: Economic Analysis mainly focusses on systems thinking in terms of more deeply understanding the economic structures and incentives that are influencing market actor behaviour.
Preconditions and preparation: These tools require a basic understanding of economics and moderate mathematical/quantitative skills. It also relies on access to existing data – so gathering secondary studies, and lining up interviews with key industry experts will help speed up the process.
Timeline and resources: To do a proper Economic Analysis would take weeks to months depending on the complexity of the market, availability of data, and the expertise of the staff.
Outputs
There are several useful outputs which provide progressively more detail and nuance on the economic dimensions of a market:
1) Quantified market channels in a market map: showing percentage of goods/services flowing through channels and captured by different actors. This builds on the core market chain from the market map and estimates the volume of sales for each actor or group of actor. Ultimately this can show us the relative size of different channels, and any major distinctions between different end markets.
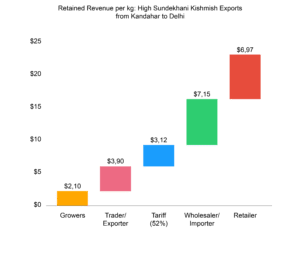 2) Value chain waterfall: identifies price points along the market chain (and where price differs by volume) to give a visual picture of how value is split across the actors. The output is a graph that shows how the same product changes in price along a value chain. It is developed by tracking and documenting the price, and then figuring out how much of the value (change in price) is captured by each actor. In the diagram below, each block shows the value captured by each actor – from growers to traders to wholesalers to retailers. In practical terms, gathering this information will require use of different data sources:
- Supplier/grower – most difficult to gather; requires primary research.
- Intermediary/exporter – often a cost+percentage basis; prices known from selling price of supplier or export price.
- Tariffs – Most can be found online (where applicable).
- Wholesaler/importer – industry specific databases or contacting wholesalers directly.
- Retailer – Survey of local prices or trip to retail outlets.
3) Mapping Value-Added Distribution goes one step further than the value chain waterfall, and identifies the value added by each segment/role based on the additional services and inputs added to improve or transform the product. This allows you to start to understand how much investment a given actor(s) is making relative to the economic gains in price/value. It involves making estimates of the incremental value added by each actor along the market chain based on their cost structure, purchase and sale prices. A simple process would be to:
- Record prices (i.e. gross output values) at the different stages in the chain for one unit of a good beginning at raw material and ending with the final product sold to the consumer.
- At each link, total input costs (such as bought-in materials and contracted services) need to be subtracted from the recorded prices.
This exercise identifies the roles of each segment and the incremental value that the market assigns to each role based on additional inputs and services to the product.
4) Seasonality Analyses are particularly important for agriculture market systems or situations with regular patterns of change over time (e.g. high-risk flooding areas). This looks beyond average prices to understand periods of high and low demand, and where there are potential price premiums. These need to be weighed up against changing costs of production at different times of year.
5) Profitability (requires substantially more data) – can look at profit margins at each stage – which can be misleading as it doesn’t reflect the relationships between volumes and prices/mark-ups.
6) Productivity – efficiency of resources utilised; expressed as output to input.
Outcomes/behaviour changes
These tools can be used to generate new insights and reflections among market actors themselves. Findings can be used to challenge assumptions during Participatory Market Mapping or to make a Business Case for individual market actors to expand or change their offerings to better reach different market segments.
Resources and templates:
MarketLinks: Value Chain Wiki, Quantitative Analysis