PDF Download: Root Cause Analysis
In a nutshell: Root Cause Analysis helps us to dig deeper into the underlying system constraints of a market system. It cannot replace the systemic analysis obtained from mapping the system through a market map but it can be useful in a participatory market mapping process, as a simple way of getting participants to dig deeper into constraints identified in the mapping process. It is basically a systematic way of continually asking the question ‘why’? One particular tool for visualising root causes is the Causal Loop Diagram (CLD), which links together different issues from various domains (economic, social, cultural) into a single visual display.
Status: Core Tool
Key principles: The dominant principle here is systems thinking. Root Cause Analysis focusses on showing the interconnections between different problems or issues. Rather than there being a single fundamental ‘cause’, it is more realistic to show a set of interlinked causes that may all reinforce each other in a ‘loop’. In key situations, it may be possible to engage market actors in developing or revising a Root Cause Analysis – in which case participation also can be enacted using this tool.
Preconditions and preparation: The Root Cause Analysis builds on the systemic constraints or issues uncovered through the preliminary and participatory market mapping processes. The starting point is a set of problems or constraints such as lack of finance; low knowledge of producers; poor coordination between market actors; lack of trust between traders and farmers; high collateral requirements of banks; and poor quality of outputs. It can also be helpful to have a framing question guiding your work: Why does X behaviour persist or dominate? Why hasn’t Y initiative led to any meaningful change? Why does the system work the way that it does?
Timeline and resources: A basic Root Cause Analysis can be completed in a few hours, however it will take longer to test certain assumptions and engage market actors. Particularly given physical distancing requirements due to COVID-19, it may be useful to produce the analysis in a virtual format that can be accessed and edited by different team members. A few free software options to consider include:
Outputs
The primary output of a Root Cause Analysis is a diagram showing the interconnection between different issues. This can take different forms – two popular options are: (1) a problem tree; and (2) a causal loop diagram.
Problem Tree
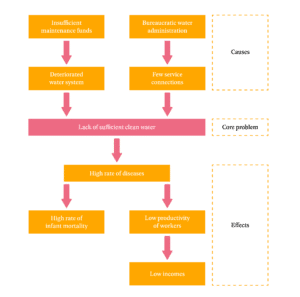
A problem tree starts with a statement of a problem, for example, the lack of sufficient clean water, as shown in the example below. You then work upwards towards the causes by asking ‘why’ in order to map backwards to deeper root causes such as insufficient maintenance funds or bureaucratic water administration. Equally you can work downwards by asking ‘so what’ to see the implications or effects, such as poor health or even low incomes.
Strengths
- Easy to get started
- Clear causal links between boxes
- Causes are easy to identify
Weaknesses
- Emphasises single chains of causality
- Overly linear view of reality
- A ‘static’ view of the system – as if things are stuck in place and not moving
Causal Loop Diagram
A causal loop diagram (CLD) takes a more circular view of the relationship between causes and effects. It introduces some specialised symbols and terms to do this in a slightly more formal way, these include:
Variables: things that change up or down. They should be labelled neutrally (e.g. crop yields).
Links: arrows between variables with positive (+) or negative (-) signs on the links (which show how the variables are connected).
Loops: a closed set of variables and links that produces a pattern. This will be labelled balancing (B) or reinforcing (R) to show the type of behaviour the overall system produces.
A balancing loop (B) leads to stable behaviour over time, as the different variables balance each other out.
A reinforcing loop (R) leads to rapid growth or decline over time, as the variables reinforce each other (in a vicious or virtuous cycle).
The below gives an example of a CLD for the dynamics of customers in a restaurant. It shows three different loops, which themselves are interconnected. In R1, a reinforcing loop, there is a cycle of more new customers leading to more customers filling tables which increase the perceived quality of the restaurant, thus leading more new customers to enter. Of course this can work in the opposite way, too: few customers at tables leads to a lower perception of quality and fewer people entering – hence it can be a virtuous (upwards) or vicious (downwards) cycle. In B2, a balancing loop, as more customers enter, and occupy tables, there is an increased length of queue to be seated, which decreases the number of new customers arriving.
Strengths
- More powerful set of explanations for behaviour over time
- A ‘dynamic’ sense of the system – it is constantly changing
Weaknesses
- Takes more time and careful thinking
- The team needs to learn about the key terms and technical tools to be able to use it

Outcomes/behaviour changes
Ultimately, the benefit of a Root Cause Analysis is to highlight a small number of key variables and their linkages – to find a leverage point that could be changed, leading to a change in the overall system functioning. This can lead to ideas for how changing one part of the system may affect the overall system behaviour.