The Market Map is the framework that Practical Action uses to visualise market systems in an intuitive way.
We use the Market Map to steer preliminary analyses and organise detailed information about the market system. We have also found it to be a powerful participatory tool – useful for building market literacy among marginalised actors and as a focus for interaction between different market actors. And therefore, we consider the mapping and analysis process an intervention in its own right.
What is a market system?
In Participatory Market System Development (PMSD), we use the concept of a ‘market system’ to describe the chain of actors that trade a particular product (a good or a service), the supporting markets that support the chain with inputs and services, and the enabling environment of rules and norms that shape the way the chain functions and who is in it.
A market system therefore describes a set of actors, relationships, functions and issues which together form a sub-sector.
We put a special emphasis on understanding the system as a whole, the way market actors are interconnected within the system, and how they interact with each other to get a good or a service from its primary production to its end markets.
Defining ‘market actors’: These are the people who make up the system, shape it and often derive income from it. They can be individuals, companies or groups. Examples include: producers, buyers, traders, processors, input suppliers, government extension agents, and policy makers.
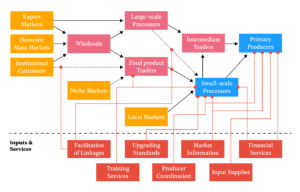
In the Market Map, the market system is made up of three area’s:
The Market Chain
The supporting inputs and services
The enabling environment (which in many cases turns out to be a disabling environment)
Figure 1 presents a generic Market Map that we use in this guidance note to describe the areas of the market system.
Figure 1: A generic Market
Uses of the Market Map
In PMSD, the Market Map is used in three quite different ways:
Analysis: It is a helpful framework to steer questions and organise information when you carry out an analysis of the market system.
Market literacy: The Market Map is used to help market actors to understand their market as a system and builds an appreciation of how the relationships and arrangements between market actors shapes how efficient the market system turns out to be.
Catalysing action: When groups of market actors map out the market system in a participatory way, it becomes a relationship-building activity in its own right and helps develop a common vision for change.
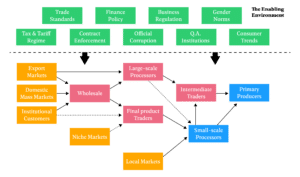
Section 2: The core market
The core market describes the channels through which a product or service moves from primary producers to final consumers, passing through each actor who has legal title over the good or service. In the middle of the Market Map is the market chain. Figure 2 presents the market chain of a generic market system. Market chain actors found between the end markets and the primary producers are called intermediaries.
Figure 2: A generic core market (sometimes known as a market chain)
Channels and product transformations
It is common for the market chain of a market system to split into channels. In different market systems channels branch out in different ways. A few common examples include:
- Different end markets supplied by common sources;
- Different sequences of intermediaries along the market chain adding value through storage, bulking, transport, processing and packaging;
- Different kinds of primary producers supplying common intermediaries.
All of these channels are evident in the example below:
The product is always transformed in some way along the chain. This transformation might be significant – such as the processing of milk into curd – or less significant – such as bulking up or packaging. This means that the product at one point in the market chain is almost always different in some way from other points in the market chain.
Different channels in the market chain often correspond to different transformations. For example, in a dairy market system, milk from the same source might be processed into curd for local markets and processed into powdered milk for urban markets, creating two different channels at the point where the milk undergoes a different transformation process.
Gender and the core chain
In order to improve outcomes for women, we need to understand where women are in the market and what roles they perform in the core chain. Analysis can reveal the approximate numbers or percentages of women in particular roles – often this will equate with roles that are less lucrative – for instance, roles associated with primary production or labour. You can indicate this information on the map by colour coding functions that are important for women. This can then lead to discussions on how to improve the conditions for these roles or how to shift women into other more lucrative roles. You can apply the same process to other marginalised groups that you are wanting to target (e.g. youth).
Fig 4: Illustrative gendered market map
Key:
% F – % of actors who are female
Yellow: Market system element significant from gender perspective
Grouping market systems together
In some cases market systems for different, but related, products have systems with very similar structures and issues, and it is practical and cost effective to group these market systems together.
For example, in central Bangladesh, our teams grouped different vegetable varieties together and mapped them as a single sub-sector system for vegetables. You must be careful not to group products with systems that have very different structures and issues. For example, in Bangladesh, our teams excluded organic aubergines (brinjal) from the vegetable sub-sector Market Map and mapped this separately because its context was very different.
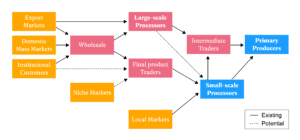
Demand from end markets and the direction of the chain
The chain itself can be considered from two directions.
Starting with the primary producer and ending with the end markets, the chain seen in this way captures the flow of goods or services as they pass through intermediaries. However in PMSD we orient the arrows of the market chain to show the flow of money from the end markets to the primary producer. This emphasises that a market system depends on the demand of final consumers and that all value derived by market actors in the system could not exist sustainably without reliable, realised demand on the part of final consumers.
It also encourages us to consider where value is being captured in the chain. Additional tools for quantifying this flow of value are available in the Tools Directory under Economic Analysis.
Figure 5: Market chain showing the direction of flow of the money/value

Explore the market chain
The level of detail you are able to build into the Market Map will depend on the availability of time and resources and the research methodology you use. It also depends on the market system context itself – you will often find it very difficult to collect some types of information, regardless of how you go about it and how many resources are at your disposal.
In all situations however, you should make sure that the market chain captures all the actors that own the product between the primary producer and the end market. You should also ensure that all the different channels of flow are mapped. This will allow you to make conclusions about how competitive, efficient and inclusive a market system is.
Here are some examples of steering questions to help explore the market chain. You may identify other questions that are important to explore in the context you are working:
Competition
- What are the different channels?
- Are they competing with each other over particular segments of the end market?
Efficiency
- How long are the market chains?
- What are the value-adding roles of each actor along this chain?
Value retention
- How is the value distributed across the market chain?
- What are the profit margins, trade volumes and total profits of different market chain actors? (See Economic Analysis toolkit)
Inclusion
- Where are the poor and marginalised actors (e.g. women, youth etc)?
- Are they in the chain, or are they conspicuously absent?
- How many are involved?
- What roles are they playing?
- What value are they capturing?
Examples from the field
Common misconceptions about who holds value – Aloe margins in Kenya
In the Turkana district of Kenya, Practical Action facilitated meetings between market actors to discuss how they could work together to increase the competitiveness of their local market system. They hoped to access national and international markets for the sought-after aloe extracts that other Kenyan regions were able to reach.
Practical Action’s team initially expected to find that the role of traders – middle men – was problematic. They had assumed this role would take value away from the producers and unnecessarily reduce the efficiency of the market chain. This is a common perception amongst NGO staff and it misreads the important functions that middle men often play. In this case, analysis of the market chain revealed that traders were delivering critical bulking and brokering functions often very efficiently, working within very tight margins.
As a result of the analysis, facilitators turned their attention to helping the market actors to improve coordination, quality of production and processing, reduce energy costs along the market chain, and coordinate advocacy around policy issues. This example emphasises the need to understand the system and the roles that different actors play rather than coming to a situation with preconceived ideas.
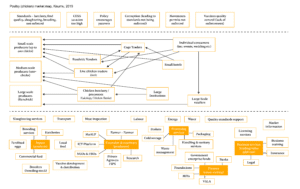
Section 3: Supporting inputs and services
The market chain is only able to function because it accesses inputs and services from supporting market systems.
Supporting the market chain
In the Market Map, supporting inputs and services are placed below the market chain. Figure 6 adds the inputs and services supporting the market chain in a generic market system.
Figure 6: A generic market chain with supporting inputs and services
It is helpful to include both inputs and services that market chain actors already use, together with those that are important for market chain actors but that are currently missing and or not working well. Using different colours to differentiate these is very useful (not shown in Figure 6).
Map the supporting inputs and services
It is relatively straightforward to map out the supporting inputs and services. Work your way along the market chain asking the following question for each market chain actor:
- What inputs, services and advice does this core market chain actor need to use to play the role that it does in the market system? Include both what they currently have access to and what they might not, but need to become more efficient.
Explore supporting markets and providers
In a single market system the nature and effectiveness of supporting inputs and services varies. So, once you have identified the inputs and services some questions that can help you evaluate them are:
- Are the services present but ineffective?
- Present but not reaching target groups? Or totally absent?
- The category you place them in will influence intervention strategies.
Providers:
- Who is delivering each supporting input and service?
- They are likely to include private enterprises, government agencies, and NGOs.
Delivery mechanisms:
- How is each supporting input and service accessed?
- Are there free markets operating, controlled and/or subsidised markets or fully controlled delivery mechanisms?
Formality:
- Are the supporting inputs and services accessible through formal, informal or illegal mechanisms?
Gender, and inputs and services
The provision of access to inputs and services will not always be equal. Women and other marginalised groups, such as youth, may find it more difficult to access particular services for a number of reasons. In some markets, inputs and service provision may be dominated by men, who for practical or cultural reasons, cannot serve women. The way services or inputs are delivered may not fit in with women’s time schedules or their mobility. There may be requirements (e.g. access to a land title), that women cannot meet for services such as finance.
When you are preparing your Market Map, identify where women have less access to inputs and services – you can mark this on the map with a coloured pen. Figure 7 below illustrates a simple example of this.
Figure 7: Gendered Inputs and Services
The analysis in figure 7 could result in further investigation that gives you a deeper understanding of what is happening and which ultimately will help you identify suitable interventions. For instance:
- What is the reason women lack access to phones – could it be income levels or social norms? Are there other ways women can get information that would by-pass these constraints?
- Why can women not join cooperatives – are they constrained by formal regulations or gender dynamics? If women can join cooperatives, will they be heard? Alternatively, what are the potential benefits and the possibility of developing ‘women only’ groups?
Mapping supporting markets
It is possible to go one step further and map the market for a supporting input or service. To do this, the supporting function becomes the subject of the core chain and a whole Market Map for the supporting market system can be explored. It may be desirable to map out a supporting market system if it becomes clear that it is a priority issue for the primary market system. However, be aware of the additional time and resources required to carry this out.
Examples from the field
Mapping supporting market systems
Practical Action have piloted the use of Market Maps focused on products and services that are often found in the supporting input and services area. Our experiences indicate that the Market Map is an effective framework in all the cases we’ve tried. For example, we’ve used Market Maps to:
- Analyse charcoal and biomass energy provision systems in Kenya and Sri Lanka respectively;
- Understand how best to achieve effective technology transfer and innovation around climate change technologies around the world;
- Enable us to understand vocational skills and employment systems in Peru and Nepal.
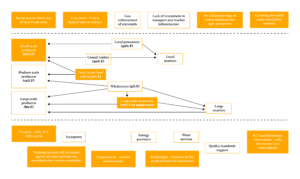
Section 4: The enabling environment
The enabling environment of a market system covers the diverse set of issues that act like the ‘rules of the game’, shaping how the market chain and supporting inputs and services operate.
The rules of the game
Many issues shape how market actors in the market chain, and in the supporting markets, do business and secure their livelihoods. Examples include:
- Macro-level economic and market trends;
- Laws, policies and regulations, and the mechanisms through which they are enforced, enacted and implemented;
- Quality, trading and other standards, and the mechanisms through which they are assured;
- Informal norms in the economy, society, culture (gender norms and stereotypes).
Here are some examples of questions that can help steer the exploration of the enabling environment:
Laws, policies and regulations:
What are the government directives that influence important factors impacting the subsector? These may relate to taxation, subsidies, land tenure, natural resources, contracts, trade and other issues. The key is to identify issues that affect the performance and inclusion observed.
Enforcement, enactment and implementation:
How are laws, regulations and policies actually enacted? Are they effective? Are there illicit activities that circumvent government directives? Often policy alone is not enough, and an area of intervention can be to support better implementation.
Standards:
What standards exist that market actors interact with? What are their terms and how are they assured?
Power structures:
What are the power structures behind the formal and informal institutions involved in the market system? Who is empowered and protected and who is marginalised in these structures?
Gender and the enabling environment
Some of the issues that fundamentally determine how women engage with markets will relate to informal norms. It is therefore critical that you ask which social and cultural factors affect gender equity and social inclusion in the market system. Norms that mean women bear the bulk of responsibility for care work will limit their time and thus, their involvement in economic activities. Norms about ‘men’s work’ and ‘women’s work’ will influence which roles you find women in. These cultural norms may then be reflected in formal rules – for instance Government support for specific crops being targeted at men only. Understanding these sorts of issues and highlighting them on your market map is critical. Guidance on how to develop this understanding is available in some of the resources cited below and in the Empowering Marginalised Actors Tool. Figure 8 below demonstrates how you can highlight these issues on your Market Map.
Figure 8: A gendered enabling environment

References and Further Reading
- Ndegwa, J., (2011), Bioenergy Market System Development: Comparing Participatory Approaches in Kenya and Sri Lanka. Policy innovation Systems for Clean Energy Security (PISCES) Working Paper (Accessed 14 December 2021)
- USAID, (n.d.) Value Chain Wiki, Microenterprise Learning, Information and Knowledge Sharing (microLINKS) (accessed 23 January 2012)
- Kidder T et al, 2016, Participatory Methodology: Rapid Care Analysis, Oxfam 2016
- Unpaid care work in market systems development, Measurement practices in WEE, LEO Brief, USAID, 2016
- International Labour Organisation (ILO) ‘Bending the Rules’